
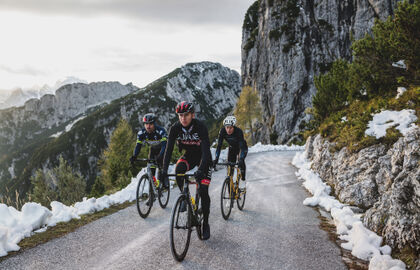
Slovenia. A land of infinite potential for your business. Benefit from Slovenia's green qualities, creative talent and smart solutions.

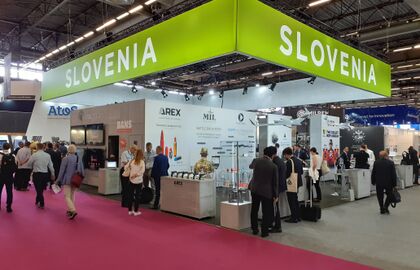

CREATING OPPORTUNITIES WITH THE RIGHT APPROACH
DOING BUSINESS THE RIGHT WAY

WORKFORCE AT ITS BEST
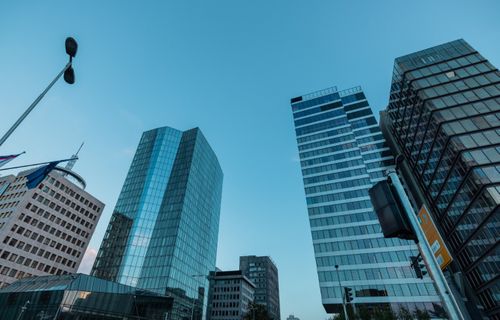
SLOVENIA'S CREME DE LA CREME OF BUSINESS EXCELLENCE

TOP TALENT, EXCELLENT SUPPORT
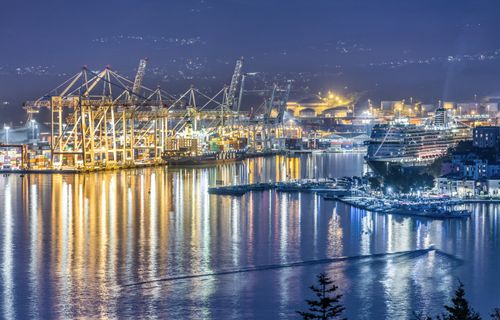
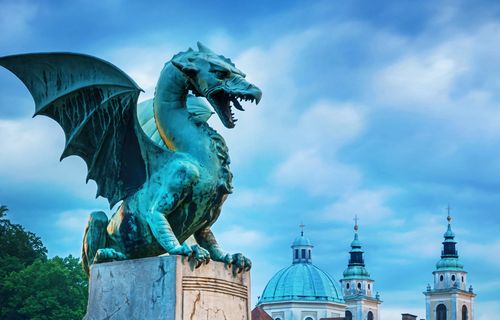
EASY ACCESS TO ALL OF EUROPE